Start Pages with Key Performance Indicators (KPIs)
Start Pages can either contain simple welcome messages or they can display Key Performance Indicators (KPIs) that are tailored to a specific business view. Identifying and tracking the right KPIs help you to evaluate objectives across different disciplines and check if the objectives are being met or exceeded.
Example: Start Page of the Change Management business view with a KPI
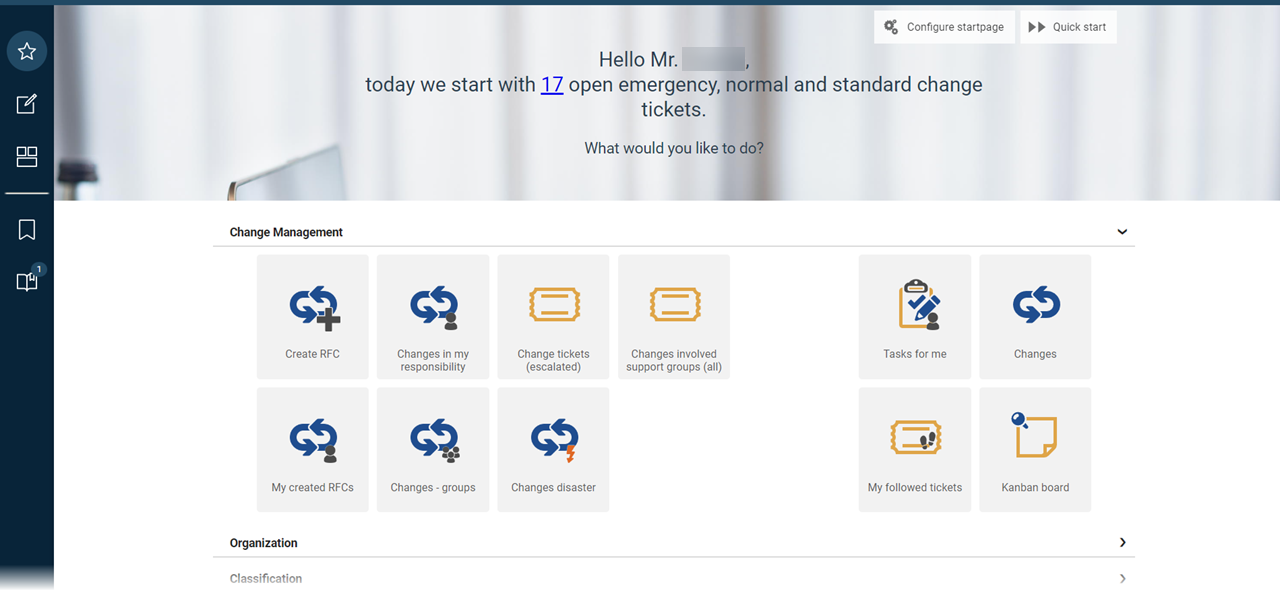
If you switch to the Change Management business view, there is a welcome message on the Start Page that actively informs you of the number of ticket types currently open.
Click the active KPI link in the message to open a detailed graph in a separate window.

Currently the following business views can have active KPIs:
Business View | KPI | Note |
|---|---|---|
Incident Manager | A number of open call, incident and service request tickets. | For each ticket class (calls, incidents and service requests), one trend line is plotted from top to bottom. |
Problem Management | A number of open problem and workaround tickets. | One trend line is plotted from top to bottom for each ticket class. |
Change Management | A number of open emergency, normal and standard change tickets. | For each ticket class (emergency, normal and standard change tickets), one trend line is plotted from top to bottom. |
Notes on the Customization
There is a CalculateKPI process in the background. This process is able to calculate the exact number of each ticket class and save it into the KPI values object.
In the KPI values catalog, there are specific KPI values which the final KPI graph is built on.